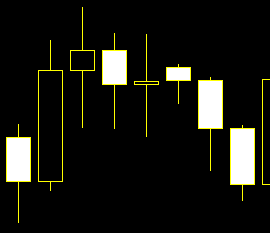
list of doji symbols with there meanings ?
reader’s message
———————
I was hoping if you had a list of doji symbols with there meanings ?
If so could you please send a copy , thank you in advance take care !
———————
click here
A Doji pattern indicated by the Open and Close being equal or almost equal,
this is very important to trade good timing.
in effect the stock has closed pretty much

Basic Knowledge on Famous Doji Pattern still in the early stages of an uptrend
https://youtu.be/L_wzICMnEnA
A doji formation is a single-candle pattern.
It occurs when prices opened and closed at the same level.
Basically, the body of the doji pattern is very small that it almost looks like a straight line.
A doji represents equilibrium between supply and demand, a tug of war that neither the bulls nor bears are winning.
Traders should not take action on the doji alone.
They should always wait for the next candlestick to make an appropriate trade.
Otherwise they may find it difficult to save their investment and get their desired profits.
A doji indicates the instability of the market.
It may create confusion among the traders, as doji shows the indecision of the buyers and sellers in the market.
The previous patterns or in some cases the next pattern after a doji can help the traders make an accurate prediction about the market.
After a long uptrend, the appearance of a doji can be an ominous warning sign that the trend has peaked or is close to peaking.
All About Doji Patterns t is better to go with the predictions of those zonal patterns
How To Read Japanese Candlestick Patterns predict almost the perfect ways of investment
There are 4 different types of Doji candlesticks.
When a Doji is formed, traders pay special attention to the preceding candlesticks as they can help taking the proper decision.
If a Doji is formed after a series of long hollow bodied candlesticks, that Doji signals the buyers are exhausted and weakened.
The reverse situation, a doji formed after a series of long filled bodied candlesticks, signal the exhaustion and weakening of sellers.
The spinning tops, which are candlesticks with long upper and lower shadow also indicates the indecision between the buyers and sellers.
There is also morning star, shooting star, evening star patterns.
These patterns consist of three day signals.
The morning star foretells the rising prices of the market while the evening star is found at the end of the uptrend.
The shooting star is also known as an inverse hammer.
This means that the top is near.
The Japanese foretells are being popular for their effectiveness and people are using them for making their trading decisions.
So, it is very important for the traders to know the signals.
Why is the Doji In Diagram B Not Recommended for Trading
Are you talking of all the candles and Doji A and Doji B in the Big Circle
when doji appear then no entry
Forex doji true mean and strategy
