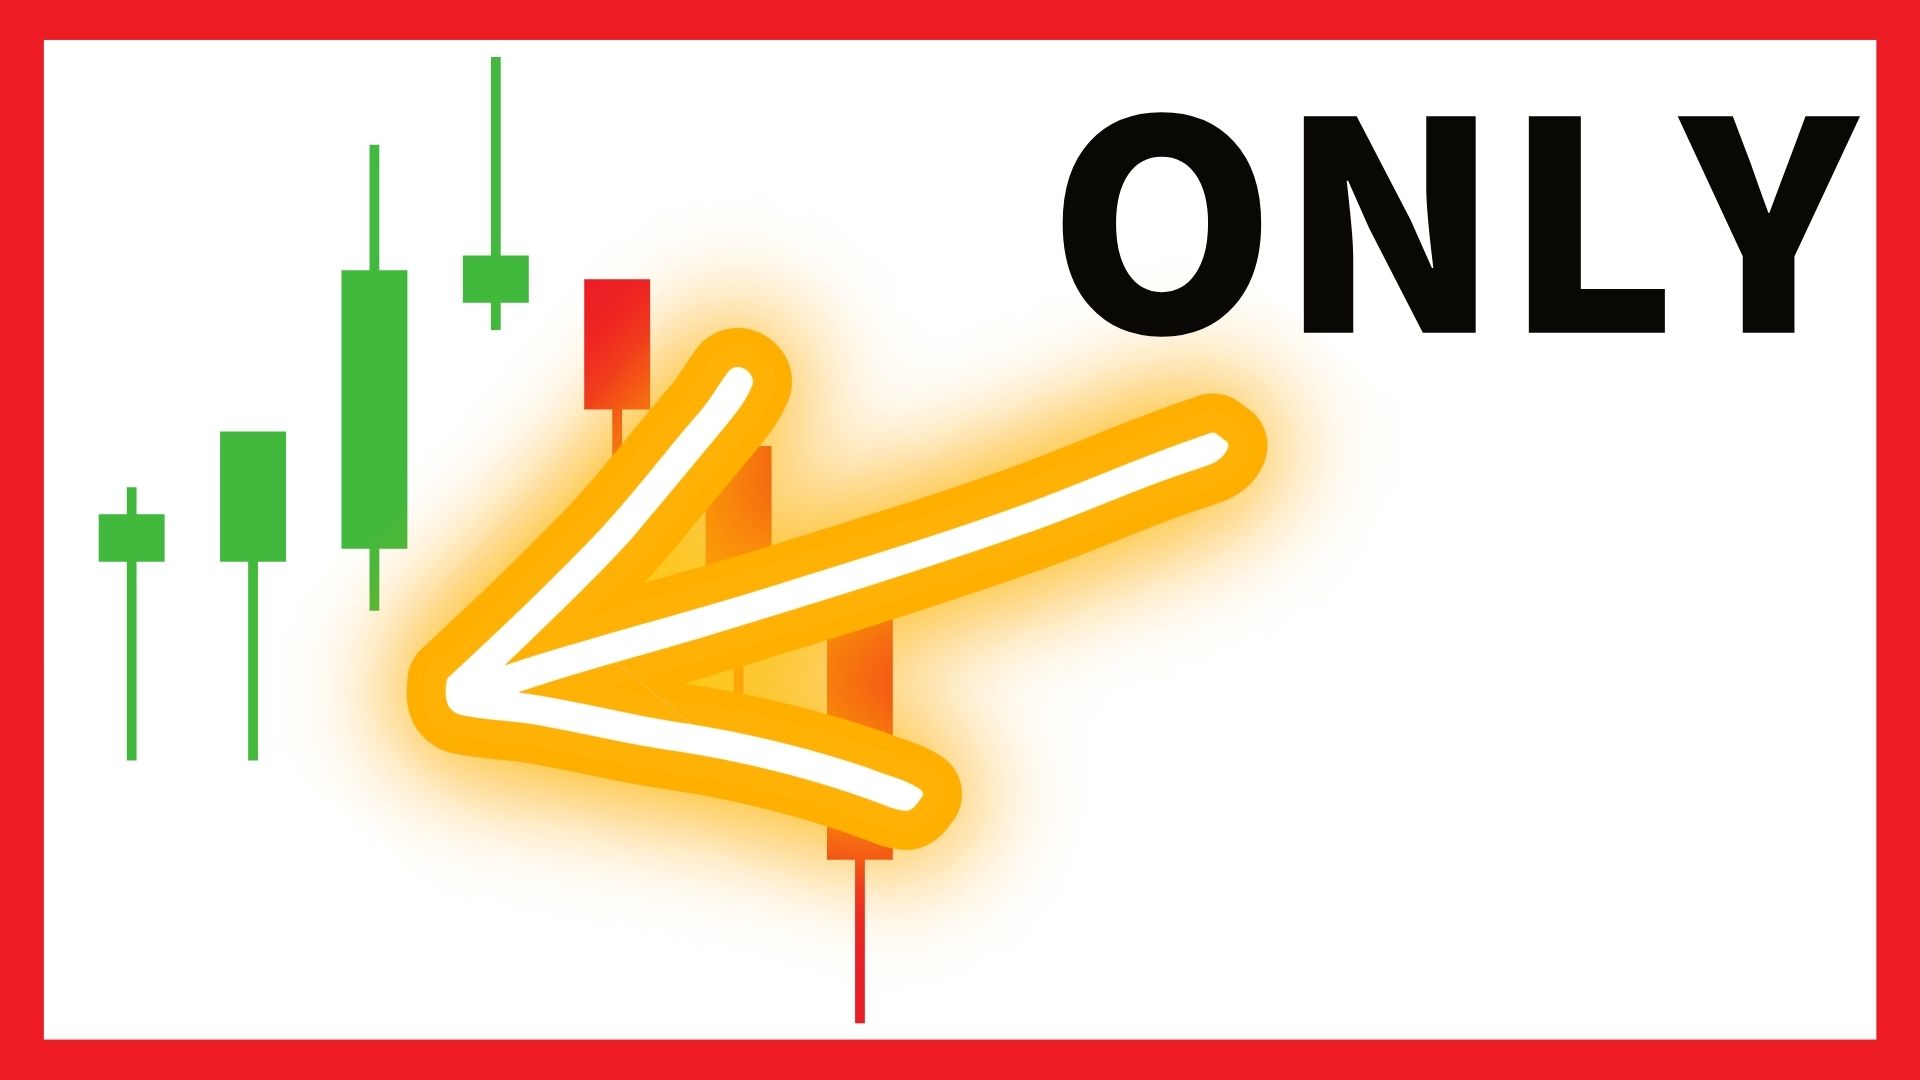
Patterns related to yesterday candlesticks
If you look at the market closely, it is very easy to detect patterns that are related to yesterday’s candlesticks.
This means that the current candlestick pattern is in a way related to the candlesticks that were formed a day before (yesterday).
Such pattern, which are related to yesterday candlesticks, occur when the yesterday candlesticks that were formed had a very profound impact on the market.
For example, if some market news are released and the news causes a change in the market trend
resulting to the formation of one or several long candlesticks. This effect is most likely to affect the following day’s candlestick pattern.
https://youtu.be/wttzGuddXXc
Time frames and chart types candlesticks
What are time frames? They are periods within which candlesticks form; from the time they are opened to the time that they are closed.
The time frames control the opening and closing of candlesticks rather than the other way round.
There are different time frames depending on the trading platform which a trader chooses to use.
The most common time frames that are used are 1 minute, 5 minutes, 15 minutes, 30 minutes, 1 hour, 1 day, 1 week and 1 month.
For example, if you are using the 1 day (daily) time frame, the candlesticks in your trading chart will take one whole day to form (open and close).
Also, there are different types of charts and the trader should choose the most convenient to trade.
https://youtu.be/8n0GIIJMc14
Gap opening reversals and continuations candlesticks
Gaps are very profitable if traded correctly; after analyzing the gap formed before placing an order.
This is because there are different types of gaps which include; breakaway gaps, common gaps, exhaustion gaps and continuation gaps.
The type of gap will either signify a reversal or a continuation of a trend.
The exhaustion gaps and the breakaway gaps are the ones that shows a reversal or the onset of a
new trend while the continuation gaps occur in the middle of a trend and shows that the current trend will still continue.
The trader should choose wisely how to trade depending on the gap type. If the gap indicates a trend reversal,
then the trader should close the running trades and place his or her trade in anticipation of the reversal and
if it the gap shows a continuation of the current trend, then the trader should not close the running trades and
if he or she decides to trade he or she should place trades in line with the current trend.
https://youtu.be/OrsmXXzIgUU
Selecting our market candlesticks
As forex traders, we should be very careful when selecting our market candlesticks.
The market that you choose to trade affects a lot of things in forex.
Some of the things that are affected by the market candlestick that the trader chooses to trade are
the time to trade since different financial market open and close at different times and frequency of trading
since different markets have different volatiles among many other things.
Although different markets have different market price movements,
it is a wise practice to correlate markets that share similar base currencies and especially if it is the US dollar.
Trend on bar gap Open candlesticks
Bar gap also called “gap” is an instance in the market where a candlestick opens
at a price that is not the same as the one which the previous candlestick closed at.
The bar gap can be either upwards or downwards.
There are different types of bar gaps which are caused by different events in the forex market.
There are gaps that signifies a change in the market trend while others shows a continuation of a market trend.
In most cases, the gaps will be filled (candlesticks will be formed to fill the gap).
What matters is the duration taken for the gap to be filled. The type of the gap will determine the duration it takes to fill
the gap and the trader should understand the type of gap before trading the gap.
https://youtu.be/CgbRTdTmQEs

